The data table panel

displays the attribute data of your layers. You can customize the columns displayed by default for every slide.
Select columns
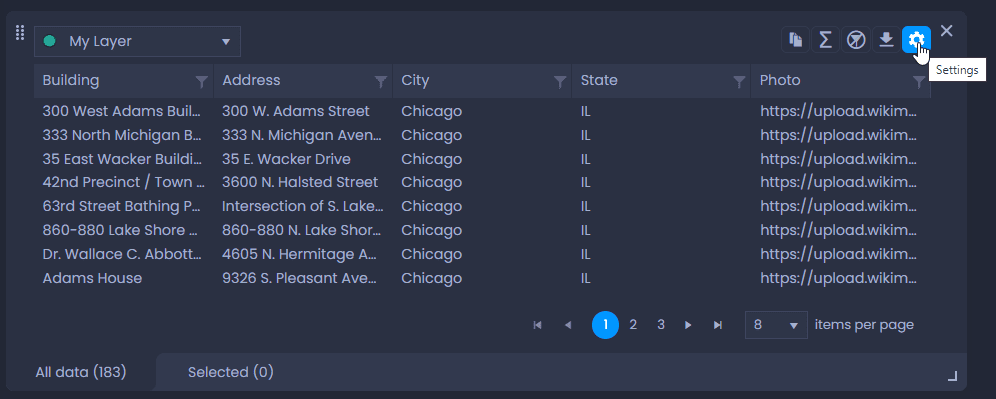
By default, CartoVista will select and display the first five columns of your data set. To change the selection, click on the settings gear of the data table:
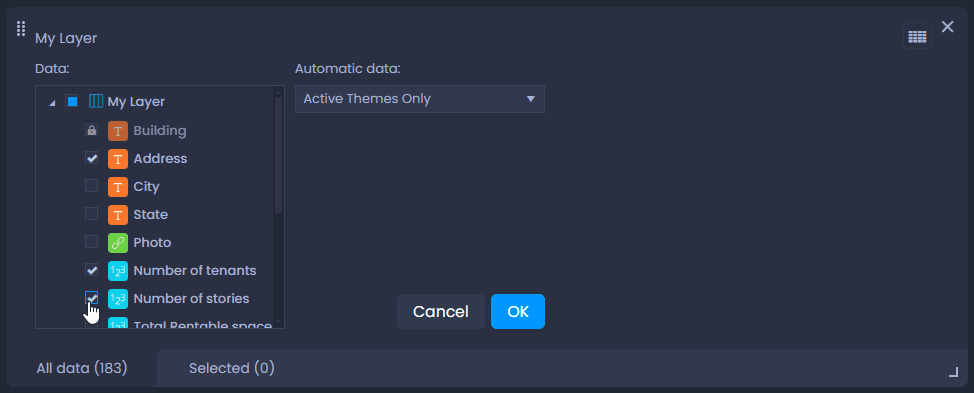
Then, select the columns to be displayed by checking them in the list. You can also remove columns. Then click “OK“:
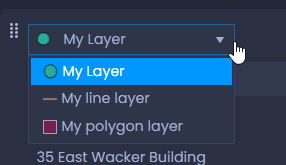
You can switch to another layer’s data table if your map has multiple layers. Click on the name of the layer in the top left-hand side corner of the panel and select another layer from the list:
Save your column selection in your slide
To save your selection, switch to the edit mode of your slide if you are not currently editing it:
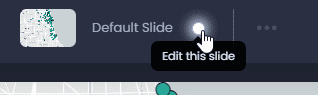
Then, save your changes by clicking “Save” or the green dot in the top bar

:

By saving your slide, all other slide elements will be saved. See what other elements will be saved here.
Automatic Data and Feature Name
Some columns can be handled automatically in your map.
Automatic Data
Automatic columns can be added depending on the thematic analysis of your slide. This is handled by the “Automatic data” option:
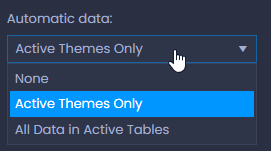
- None: no automatic data will be added.
- Active Themes Only: the column(s) used in the thematic analysis will be added to the data table.
- All Data in Active Tables: all the columns of the data table used in the thematic analysis will be added to the data table.
Feature Name
The column used for the feature name will also automatically be displayed. This column should have identifiers or names to help users identify each feature. In the data table settings, this column is locked with

.
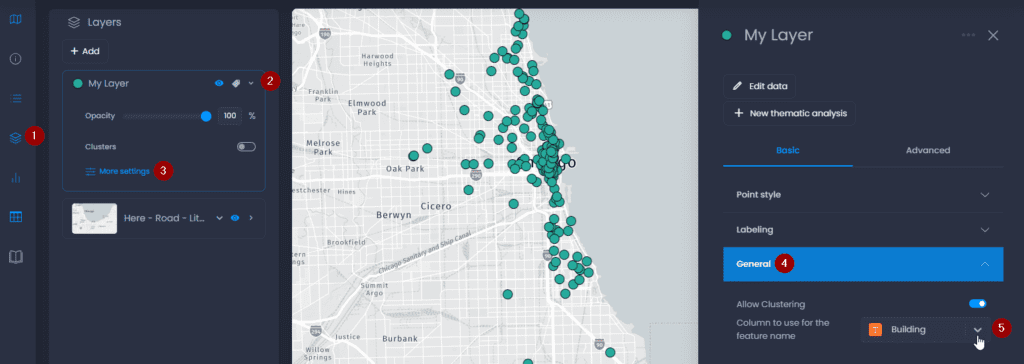
By default, CartoVista selects the first column of your dataset. Here are the steps to change this column:
- Open the Layer control
- Click on the down arrow next to your layer’s name to show the details,
- Click on “More settings“
- Click on “General“
- Change the column selected for the “Column to use for the feature name“: