The spatial aggregation tool allows a user to retrieve key statistics such as the average, sum, minimum, and maximum values of point attributes located within a polygon layer.
In the example below, the polygon are the counties in Florida and the points are customers of franchises.
Each points contains some key metrics used in geomarketing such as spending per trip, income, distance from the franchise and the spatial aggregation will give us the number of customers, the average spending per trip… within each county

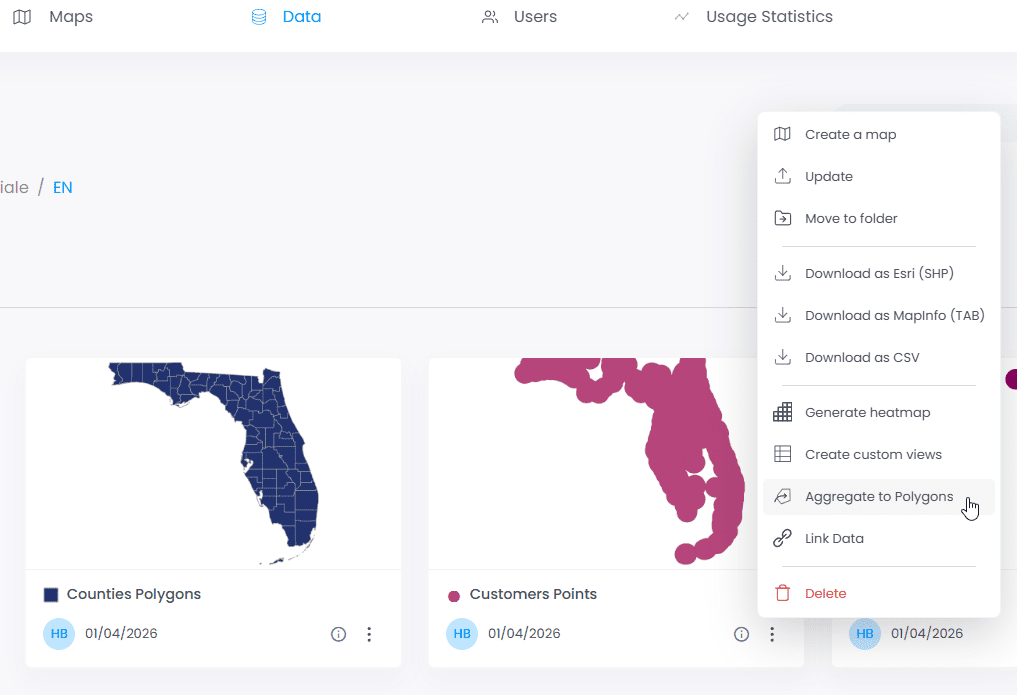
To start the aggregation, In the Data tab, click on the 3 dots next to the layer containing the points:
In the following window, first select the polygon data layer:

Select the fields for which you want to aggregate the data, In our example, we will retrieve the statistics for the “Customer Spending per trip” attribute.

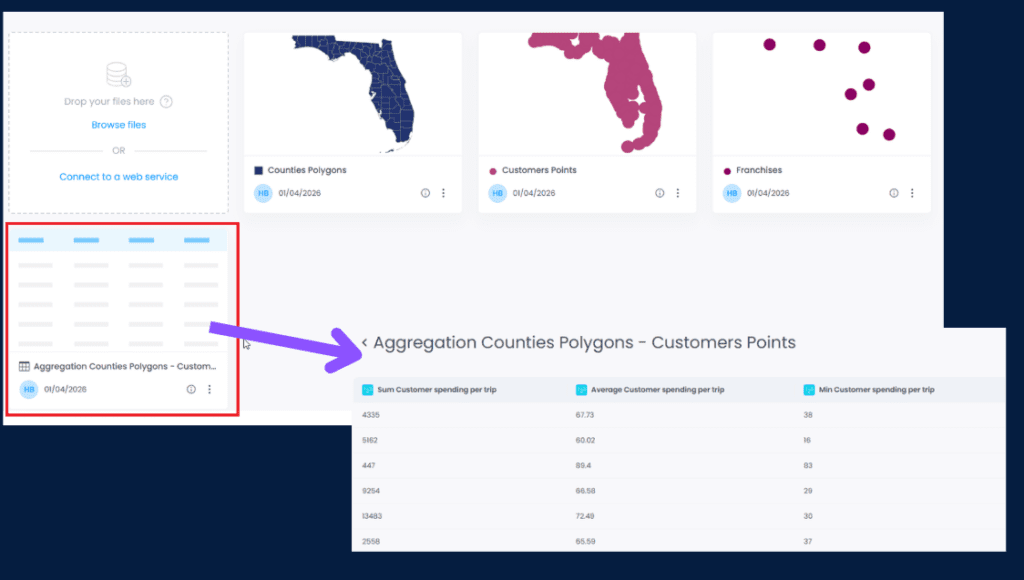
After clicking “Done,” a new data table is created, “Aggregation Counties Polygons”. This layer contains the metric Customer Spending per county (Average spending, sum, etc…)
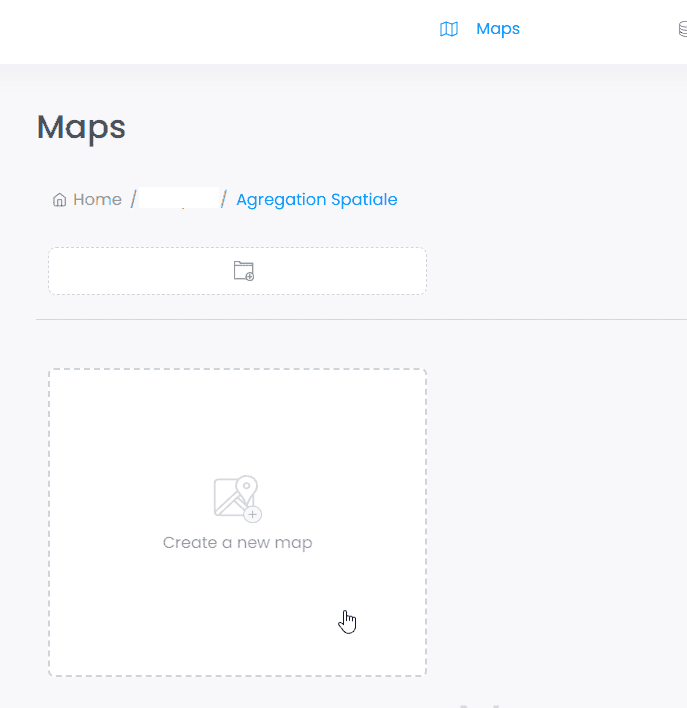
To start displaying the new table return to the Maps tab and click “Create a new map”:
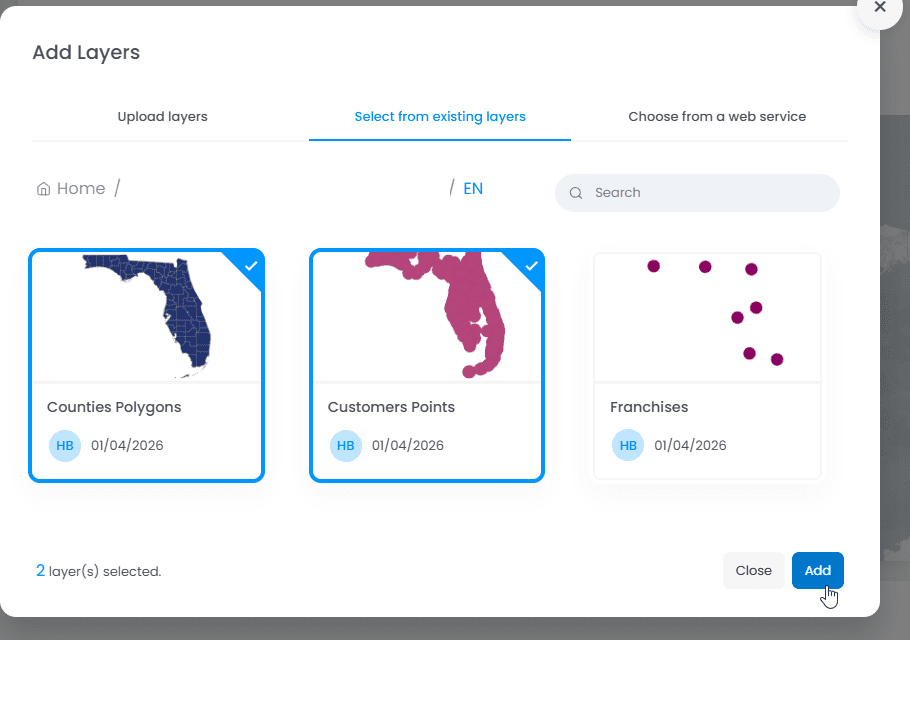
Once the map has been created, click “Add” layers and import both points and polygons layers.

Your two layers are now visible. The final step is to change the display settings:
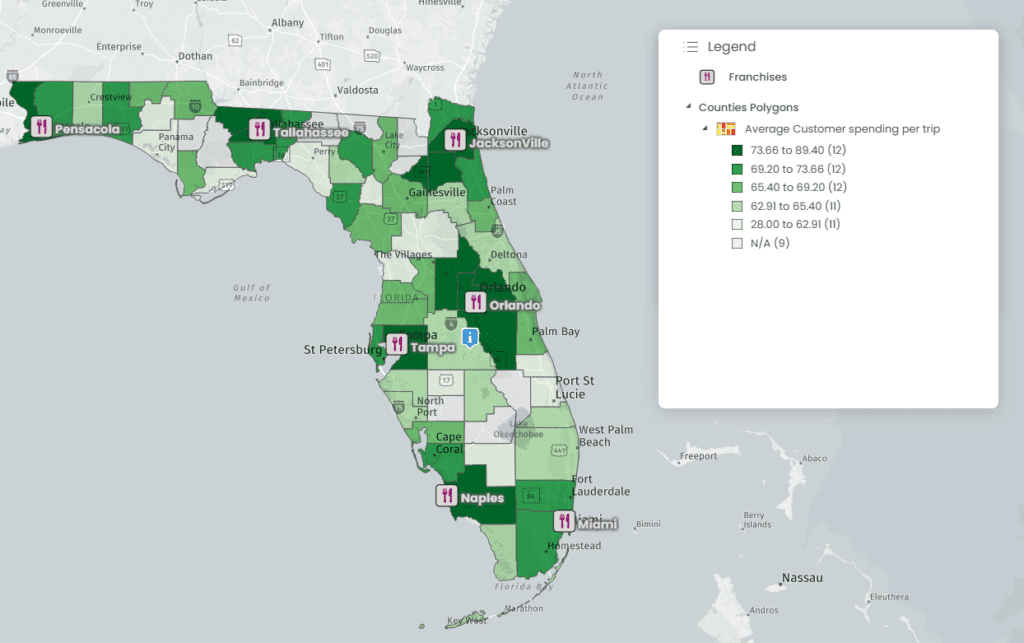
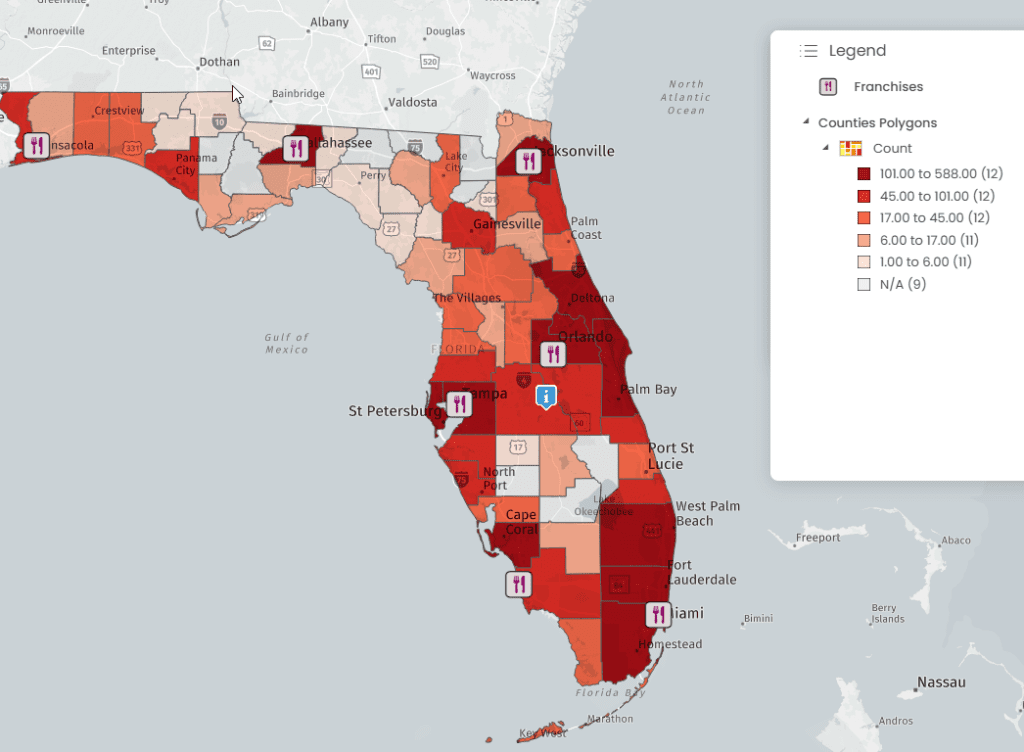
And voilà! You can now create thematic analysis on the new fields and get better insight on your point data per county