
Support
Map Navigation
Tools for exploring maps, selecting features, and exporting data.
 How to search the map
The search tool lets you easily search for map features or locations. Enter your search text and choose an item from the results list to zoom in on the selected location. Use the search tool Click…
 How to use the layer control
The Layer control is the panel where map viewers can control the visibility of layers and labels and change their opacity. It is also where map creators can edit the list of layers, save visibility…
 How to work with the Information tool
With the Info tool, query map features and visualize their attribute data easily. Learn how to interact with it. Use the Info tool Use the Info and Pan tool or the Info tool to click on the map and…
 How to select features
In a map, you can use the selection tool to select features on the map by drawing an area or clicking on features. Click on the selection tool in the toolbar to activate the tool: Click on the arrow…
 How to perform spatial intersection
In a map, you can use the selection tool to perform a spatial intersection: spatial intersection allows you to select a layer’s features using another layer’s features. For instance, you could…
 How to annotate a map
Add the annotation tool to your map to draw point, text, line or polygon annotations on your map. Customize their style and save them in your slide: Enable the annotation tool By default, the…
 How to create a drive time area (isochrone)
You can easily generate a drive time area with multiple parameters and from any location, and visualize on the map the area covered. Create an isochrone or isodistance Click on the isochrone tool…
 How to collect feedback from the public using the feedback tool
The CartoVista feedback tool is a powerful feature designed to transform your published maps into collaborative platforms. It allows citizens, researchers, or end users to submit feedback, suggest…
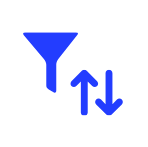 How to filter and sort data using the data table
The Data table panel allows you to sort and filter data. Filter data to show a subset of your dataset in the map, chart, legend and data panel. To sort and filter data, you will need to select the…
 How to get statistics (min, max, average, etc.) for the selected data ?
Statistics View You can switch to the Statistics view of the Data panel to view aggregated statistics on each column. Click on the statistics button to switch to the Statistics view: For each…
 How to export data
You can export data from the Data panel to an Excel file. Click on the export button in the Data panel. There are two options to export data: Tiled layers cannot be exported. See our dedicated…
 How to perform spatial aggregation of points by zones (polygons)
The spatial aggregation tool allows a user to retrieve key statistics such as the average, sum, minimum, and maximum values of point attributes located within a polygon layer. In the example below,…