

With CartoVista, you can organize the content of your map in different Slides. Each will help you focus on a specific topic or question by showing part of your data that relates to this topic or question. You can also add text and multimedia to support your presentation and reorganize panels.
Slides are easy to create and navigate from the top bar menu, much like in a PowerPoint presentation.
You can use Slides to support a presentation, convince your audience, and overall make it easier for your end users to understand your map and its data.
Create a new slide
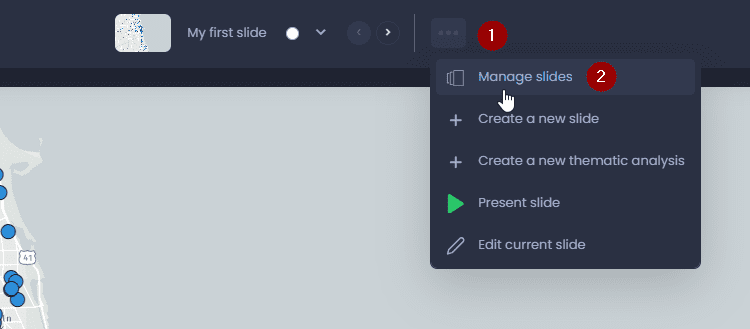
To create a new slide, click on the slide Actions menu with

and select “Create a new slide”:
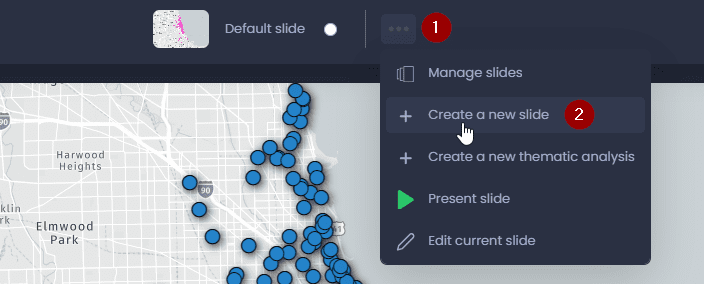
This will duplicate the current slide into a new one, and it will enable the edit mode for this new slide:
Edit the content of your slide
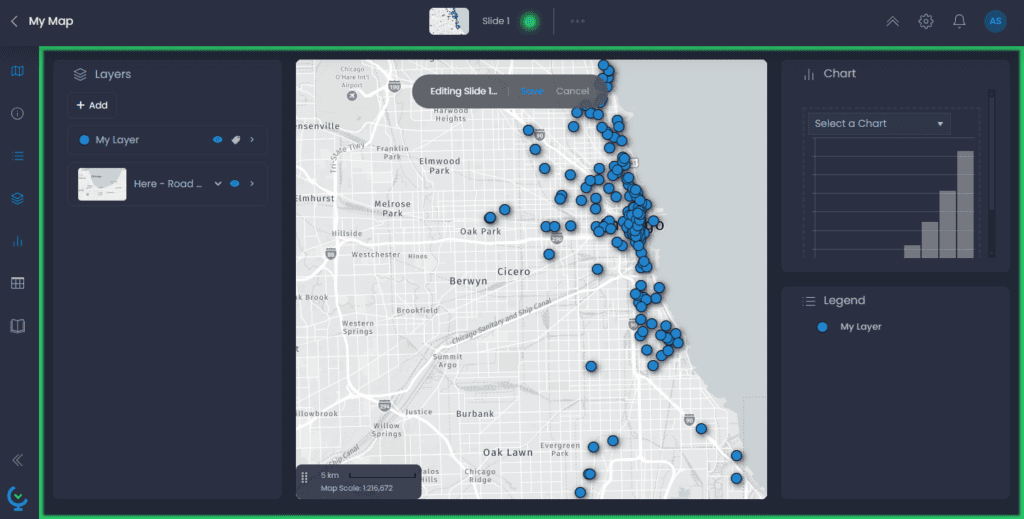
Now that you are editing your new slide, you can change its content. Everything in the area highlighted in green will be saved in the slide. This includes:
- Panel layout: open/close panels, resize them or put the map full screen to customize the layout of the map in your new slide. See our dedicated article to learn more.
- Thematic analyses: customize your slide with a new data visualization. See our dedicated article to learn more.
- Layer visibility: turn on or off layers from the Layer control.
- Basemap: choose a basemap from the Layer control. See our dedicated article to learn more.
- Map extent: pan or zoom in your map to save a custom extent in your map.
- Story content: use the Story panel to add text and images to your slide. See our dedicated article to learn more.
- Data panel columns: use the data panel to choose the columns visible by default in this slide. See our dedicated article to learn more.
- Isochrones: create isochrones from the isochrone/isodistance tool. See our dedicated article.
- Filters: filter data using the Data panel. The filtered data will be hidden from the map, chart, legend and data panel. See our dedicated article.
- Annotation: add text, point, draw lines or areas to annotate your map. See our dedicated article.
- Charts: custom charts will also be saved in the slide.
Save your slide
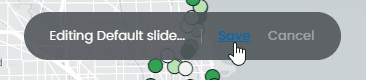
Once you have personalized your slide with all the elements listed above, you need to save your slide. Click on the green dot

or click on “Save”:
You can also rename your slide in the top bar before saving it:

Manage your slides
When your map has multiple slides, you can manage your slides to reorder them, rename them or delete slides. Click on
in the top bar then select “Manage slides“:
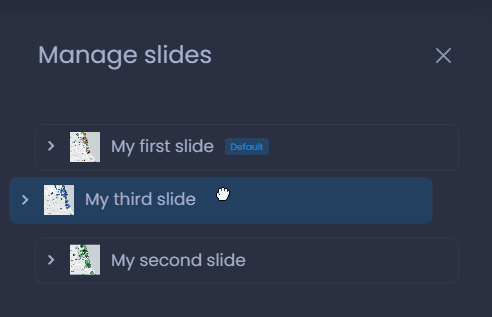
In this panel, you can reorder your slides by dragging and moving the slides in the list:
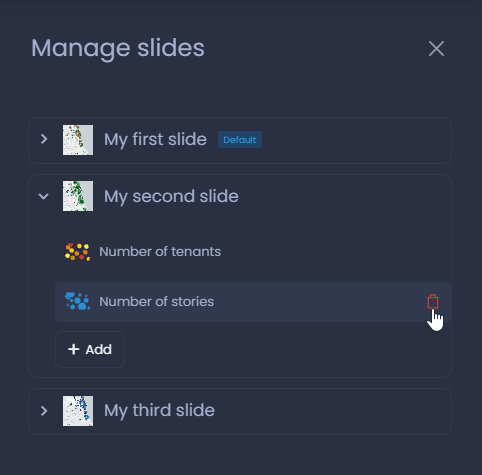
You can also see the thematic analysis created in each slide, and you can add or remove them:
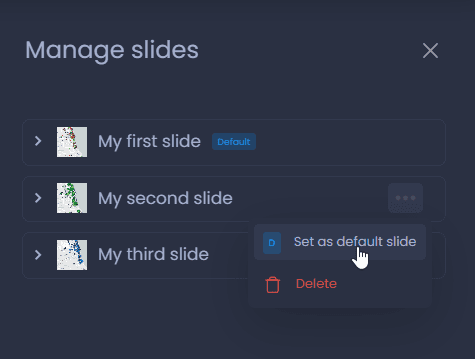
Finally, you can choose the default slide and delete slides with the
menu:
You can also edit the slide title to rename them.