In the CartoVista platform, you can import tabular data and link it to a GIS layer. All you need to do is use a unique identifier that is the same for both files. The join between the two files will be done using this shared unique identifier.
Import and link files
If you haven’t imported your files to your CartoVista workspace, here’s how to do it.
Import your GIS file
Import your GIS layer to your workspace by dragging and dropping your GIS file in the drop area of your Data Gallery. See our dedicated article to learn more.

Import your tabular data
Requirements for CSV files
The structure of your file should be aligned with CSV standards:
- the first row contains the headers
- each of the following rows contains a separate record
- each column value or header is separated by a comma (other delimiters are not supported)
- each row has the same number of columns.
- your file should contain a unique identifier identical to the unique identifier of your GIS layer.
Requirements for Excel files
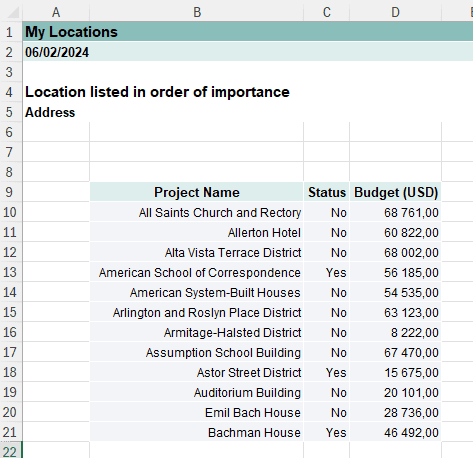
Your file should contain the headers and the values to be imported only. Cell A1 should contain your first header, and A2 your first value. Any other metadata or document titles should be removed.
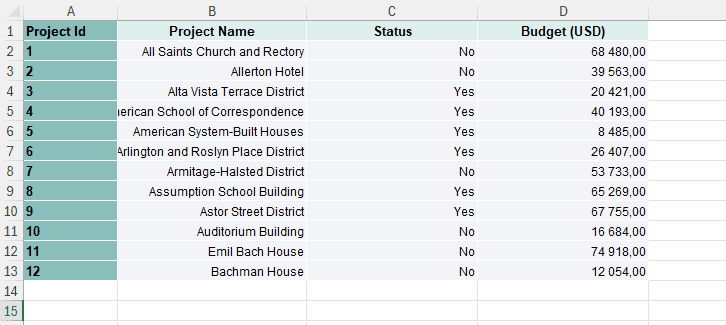
Your file should contain a unique identifier identical to the unique identifier of your GIS layer.
For instance, the following file is not valid:
This file is valid:
Add data to your Data Gallery
Drag and drop or select your file
Navigate to the Data Gallery, drag and drop your file to the drop zone, or click on “Browse files” to select your file from your File Explorer.
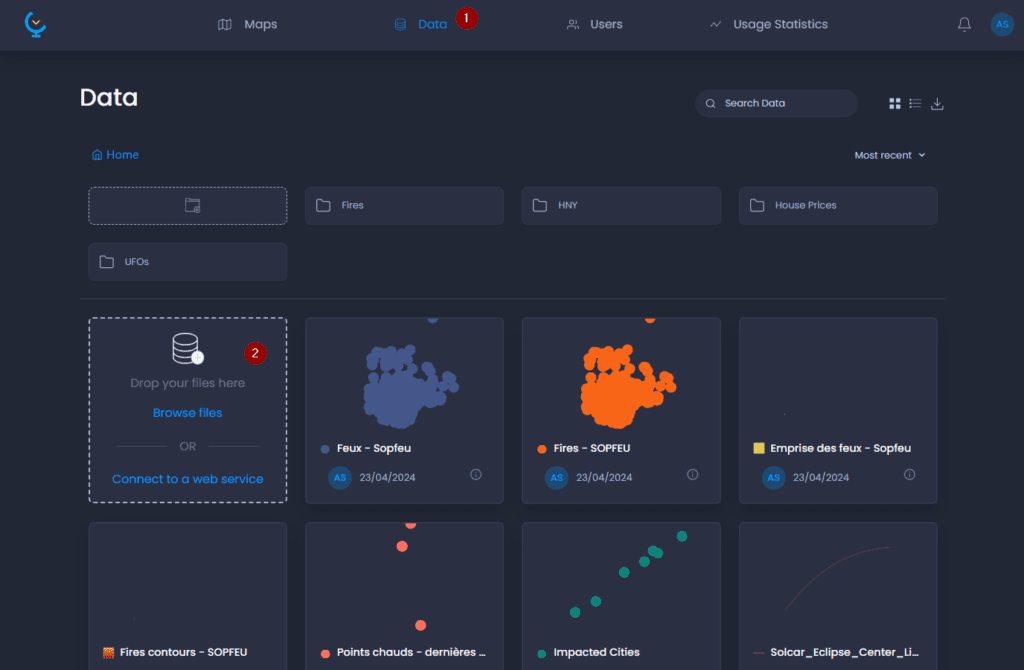
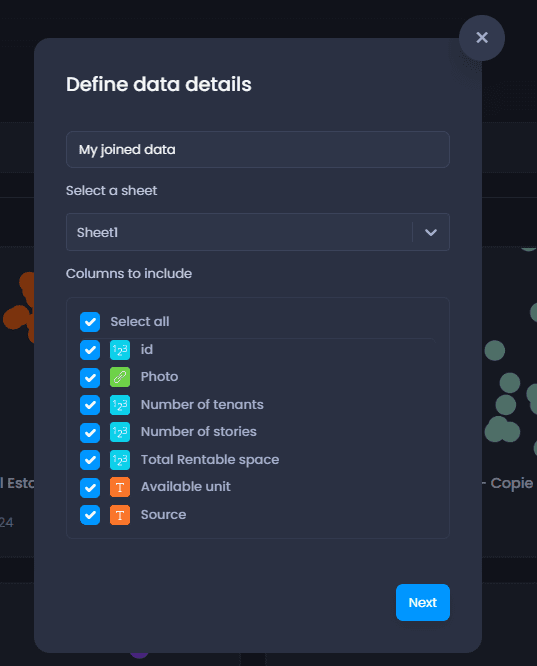
A pop-up window shows you the process of the table upload. Once the upload is completed, you can rename your table and select the attribute columns to be imported, then click Next.
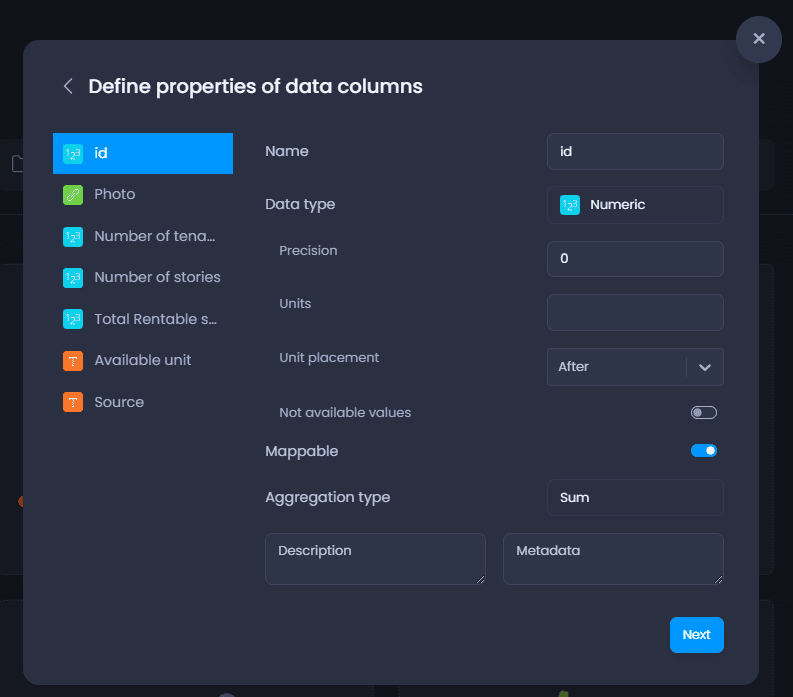
Set layer properties
The next step allows you to edit column properties:
| Property name | Property description | Column type |
|---|---|---|
| Name | This is how the column will be displayed in the map | All types |
| Data type | Numeric, String, Image URL, Date/Time. | All types |
| Mappable | When set to false, this column won’t be visible in the map. | All types |
| Aggregation type | The aggregation method to be used in charts and time-based data. - Supported aggregation types for Strings, Image URL and Date/Time are: Count, None. - Supported aggregation types for Numeric are: Average, Count, Max, Min, Sum, None. When set to None, the column cannot be aggregated and will be set to an N/A value on aggregation. | All types |
| Description | Free text to describe your column. The description is only accessible from the Data Gallery in the Column Properties. | All types |
| Metadata | Free text to add metadata to your column. The metadata are only accessible from the Data Gallery in the Column Properties. | All types |
| Precision | The number of decimals to display. Any additional precision is still stored but not displayed, meaning you can increase the precision after the import. The default is 2. | Numeric |
| Units | Units to be displayed next to the value in the map data tips, info tool, table view, charts, legend, etc. | Numeric |
| Unit placement | Unit placement after or before the value. | Numeric |
| Not available values | Enable N/A values to convert a value of this column to N/A. | Numeric |
| Value to convert | The value to be converted to N/A. This property is only accessible when Not available values are enabled. | Numeric |
Link the data table to your GIS file
Click Save to validate the column properties. The next step allows you to choose what to import this table. Select “Link data to a layer”.

You can then search and select your GIS layer from the first drop-down menu
![]()
, then choose the identifier of your GIS layer
![]()
and then select the same identifier from your data table
![]()
.
Link a data table and a layer already imported
If you have already imported your files to your CartoVista workspace, here’s how you can link them.
-
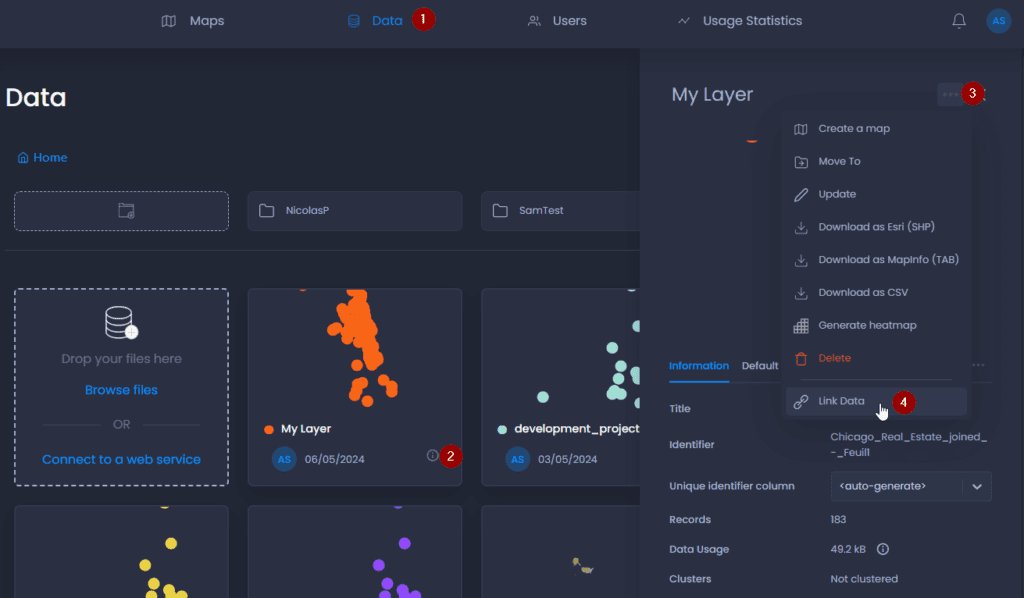
Navigate to your Data Gallery and to the layer you want to link your data table to.
-
Click on your layer’s name or

to open the details panel.
-
Click on the “…” icon to open the Actions menu.
-
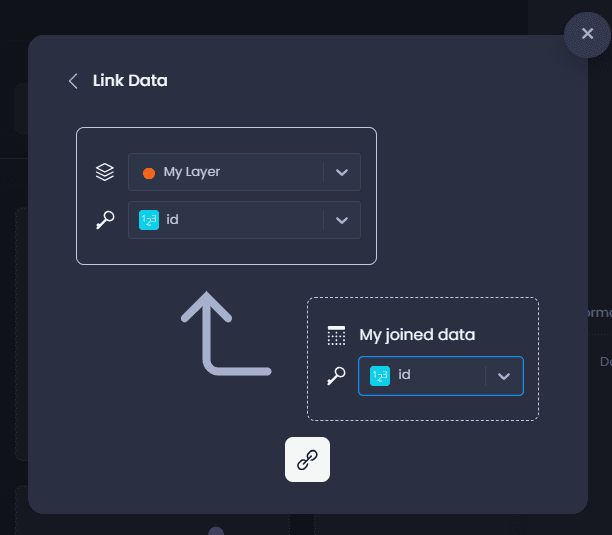
Select “Link Data”
You can then choose the identifier of your GIS layer
![]()
, then search and select data table from the second drop-down menu
![]()
then select the same identifier from your data table
![]()
.
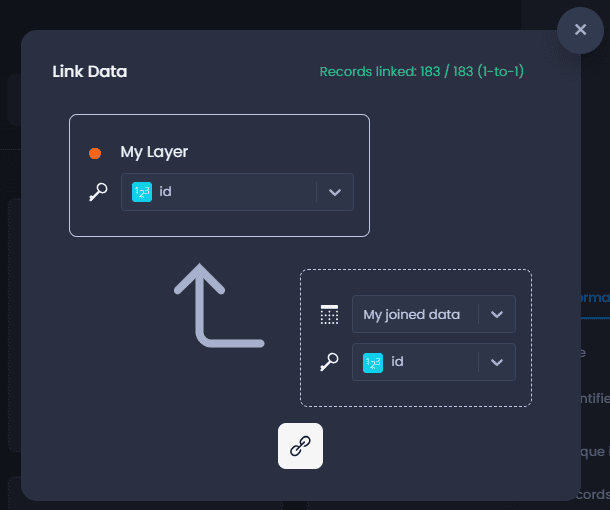
Before validating the join with the link button, check the number of records linked match your data in the top right-hand corner.
You can also start from your data table and link your layer to it, it works both ways!
Results
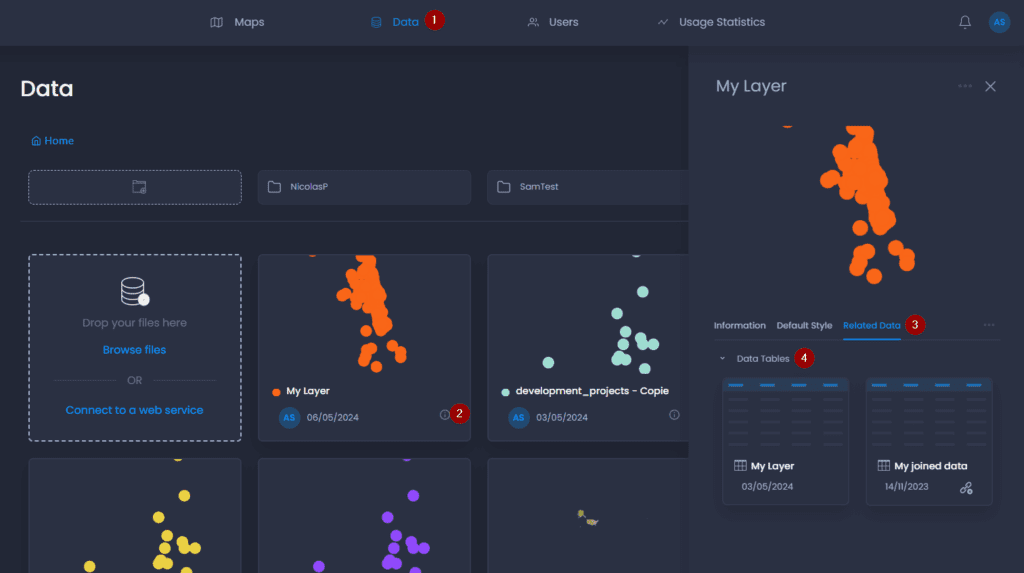
Once your 2 datasets have been linked together, you can access the columns from your data table in any map where the layer is used.
In the Data Gallery, in the “Related data” tab of the details panel of your layer, you can see that the data table is now joined to your layer.
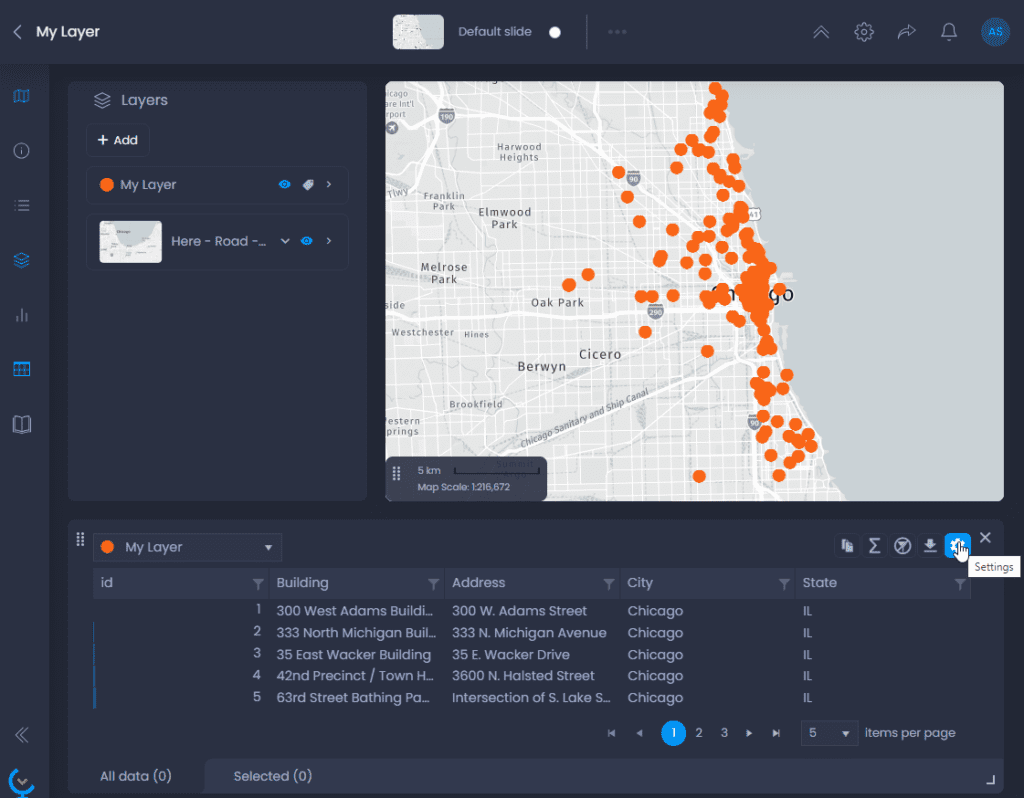
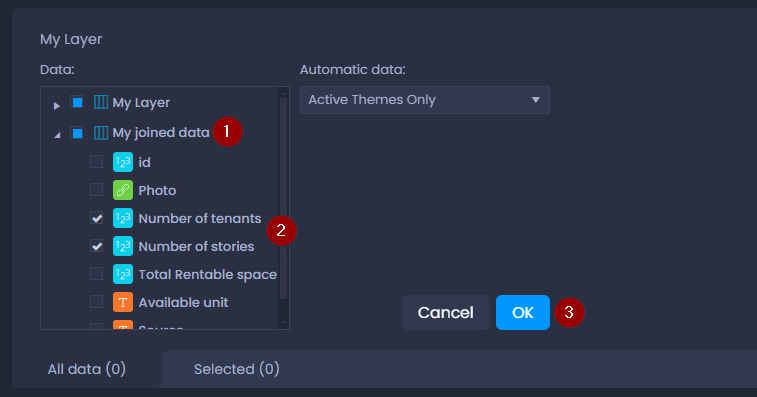
In your map, you can create a thematic analysis using any of the joined columns seamlessly. In the data table panel, you can also show the joined columns. Click on the “Settings”, then open the joined data table section and check any of the columns you want to add, then click OK.