

Add the annotation tool to your map to draw point, text, line or polygon annotations on your map. Customize their style and save them in your slide:
Enable the annotation tool
By default, the annotation tool is not active. A Map Creators with edit permissions on the map can add it to the toolbar so that all other users can draw on the map.
Here are the steps to add it to the toolbar:
- Open the Map settings
- Drag and drop the Annotation tool from the “All tools” box to the “Toolbar” box.
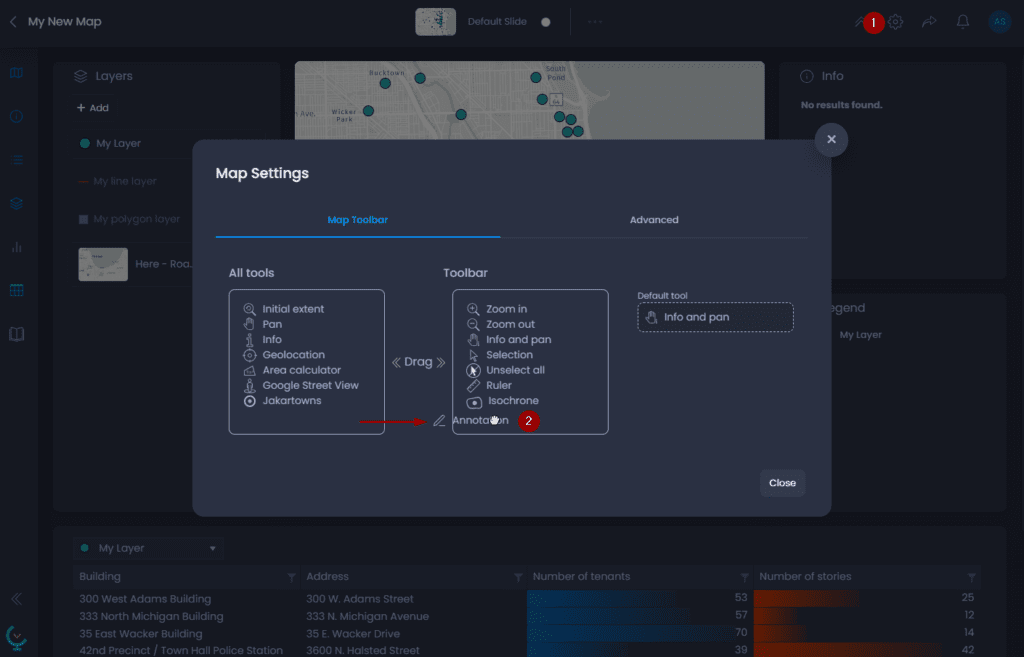
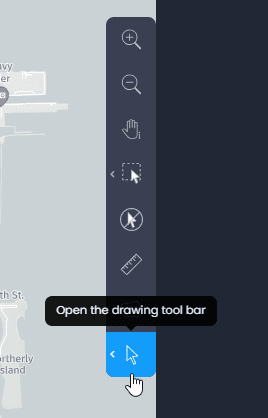
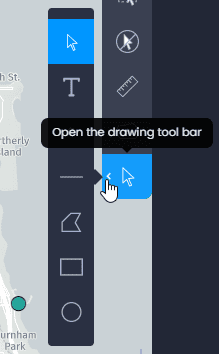
The annotation tool is now visible in the toolbar:
Add annotations
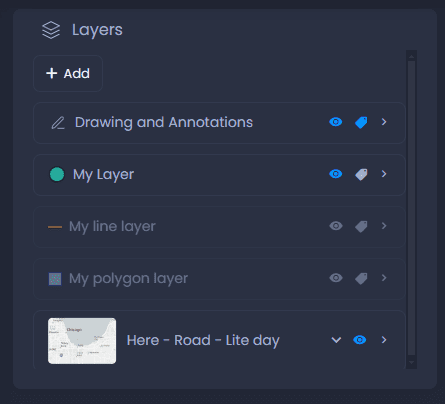
All new annotations will be stored in the Drawing and Annotations layer, which can be turned on or off from the Layer Control. The Drawing and Annotations layer can also be queried from the Data panel, where you can see the identifier and name of every annotation.
Draw the annotation
To draw an annotation, click on the left arrow of the annotation tool to see the list of available drawing tools:
Here are the available options:
-

Select an annotation: use this tool to select and edit an existing annotation. Click on an existing annotation to select it. This will open the style panel where you can customize the colors and style of your drawing (see how to change the annotation style below). You can also change the shape of the selected drawing. Use

to edit the shape (or

to edit text annotations)

to delete it, and use the hands to resize, move or rotate the drawing.
Please note that once you’ve drawn an annotation using one of the tools listed below, the selection tool will automatically be selected.
-

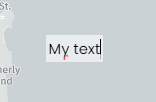
Add text: use this tool to add text annotation to your map. Click where you want to place the text and type the content. Click outside the text box to finalize the text annotation and edit its style (see below).
-

Add a point: use this tool to add a point drawing. Click on your map to add the point. The style panel will be automatically opened to edit the style (see below).
-

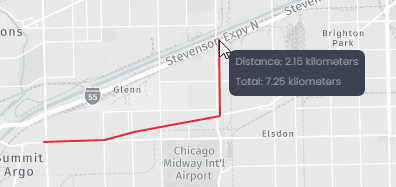
Add a line: use this tool to add a polyline. Click on your map to add the first vertice of your line, then click again to add a second vertice. For every portion of the line you draw, you will see in the tooltip the total length of the line (“Total“) and the length of the current portion (“Distance“). Add as many vertices as you want then double-click to add the last vertice and finalize the line. The style panel will open to edit the style (see below).
-

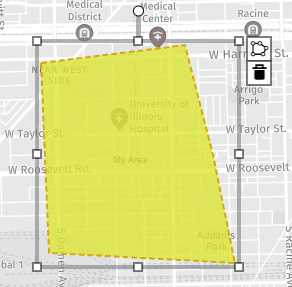
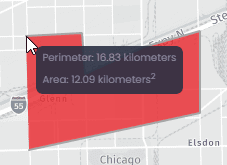
Add a polygon: use this tool to add a free-form polygon. Click on your map to add the first vertice of your polygon, then click again to add a second vertice. As you draw, you will see the Perimeter and the Area of your polygon. Add as many vertices as you want then double-click to add the last vertice and close the polygon. The style panel will open to edit the style (see below).
-

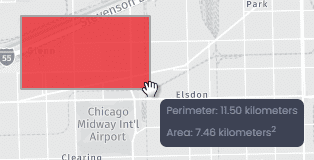
Add a rectangle: use this tool to add a rectangle. Click on your map to place the corner of your rectangle and move your cursor to draw the rectangle. As you draw, you will see the Perimeter and the Area of your rectangle. Click again to place the opposite corner and finalize the rectangle. The style panel will open to edit the style (see below).
-

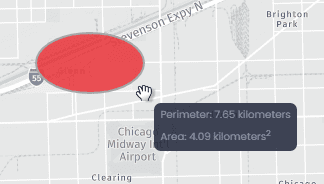
Add an ellipse: use this tool to add an ellipse. Click on your map to place the center of your ellipse and move your cursor to draw the ellipse. As you draw, you will see the Perimeter and the Area of your ellipse. Click again to finalize the ellipse. The style panel will open to edit the style (see below).
Change the annotation style
You can change the default style of an annotation in the Style panel. The Style panel will be opened automatically after the creation of a new annotation. You can also use the select annotation tool
to select an existing annotation and change its style.
Here are the style options for the different types of annotation.
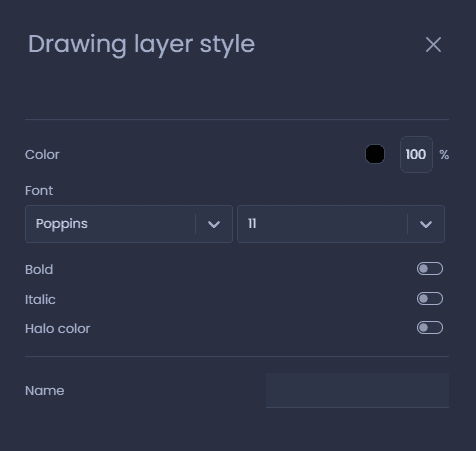
Text annotation
- Color: use the color picker and the opacity setting to change the color and opacity of the text.
- Font: choose the font and the size of the text.
- Bold: make the text bold.
- Italic: make the text italic.
- Halo color: enable the halo to add an outer line to the text. Use the color picker to change the color of the halo.
- Name: add a Name to your annotation. The name will be shown in the Data panel of the Drawing and Annotations layer.
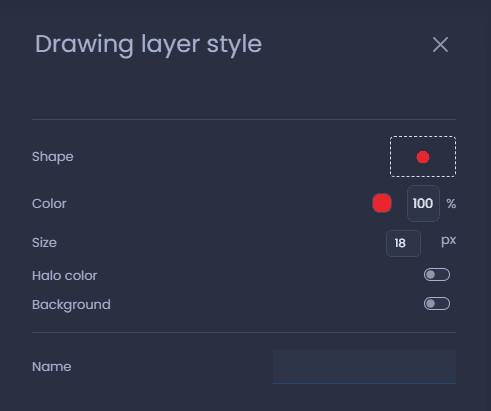
Point annotation
- Shape: click on the shape to choose an icon from the icon library. You can also import your own symbole. Please refer to our point style article to learn more on the icon library.
- Color: use the color picker and the opacity setting to change the color and opacity of the point.
- Size: the size of the symbol in pixels
- Halo color: enable the halo to add an outer line to the shape. Use the color picker to change the color of the halo.
- Background: add a background to your symbol. You can choose the background color and shape (circle, square or rounded-corner square). Please refer to our point style article to learn more on backgrounds.
- Name: add a Name to your annotation. The name will be displayed on the map as a point label. It will also be visible in the Data panel of the Drawing and Annotations layer.
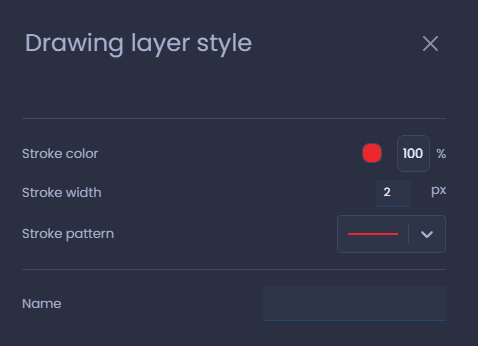
Line annotation
- Stroke color: use the color picker and the opacity setting to change the color and opacity of the line.
- Stroke width: the width of the line in pixels
- Stroke pattern: choose one of the available stroke pattern (solid line, dashed line, line with arrows, etc.).
- Name: add a Name to your annotation. The name will be displayed on the map as a line label. It will also be visible in the Data panel of the Drawing and Annotations layer.
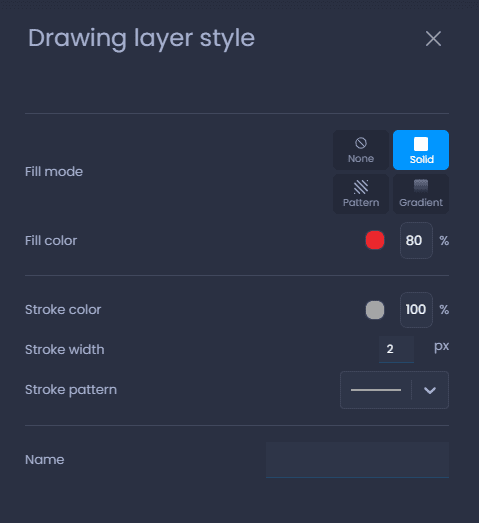
Polygon annotation
- Fill mode: choose one of the available fill modes (None, Solid, Pattern or Gradient). Please refer to our polygon style article to learn more on fill modes.
- Fill color: use the color picker and the opacity setting to change the color and opacity of the polygon fill
- Stroke color: use the color picker and the opacity setting to change the color and opacity of the polygon outer line.
- Stroke width: the width of the polygon outer line in pixels
- Stroke pattern: choose one of the available stroke pattern (solid line, dashed line, line with arrows, etc.).
- Name: add a Name to your annotation. The name will be displayed on the map as a polygon label. It will also be visible in the Data panel of the Drawing and Annotations layer.
Save your annotation
Only Map Creators with edit permissions on the map can save their annotations. Map viewers can draw annotations but they cannot be saved permanently in the map for others to see.
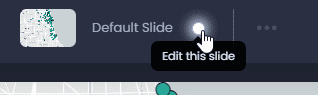
To save your annotations, switch to the edit mode of your slide if you are not currently editing it:
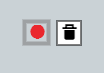
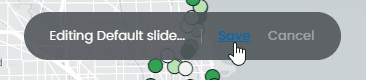
Then, save your changes by clicking “Save” or the green dot in the top bar

:
By saving your slide, all other slide elements will be saved. See what other elements will be saved here.
Change the default style for annotation
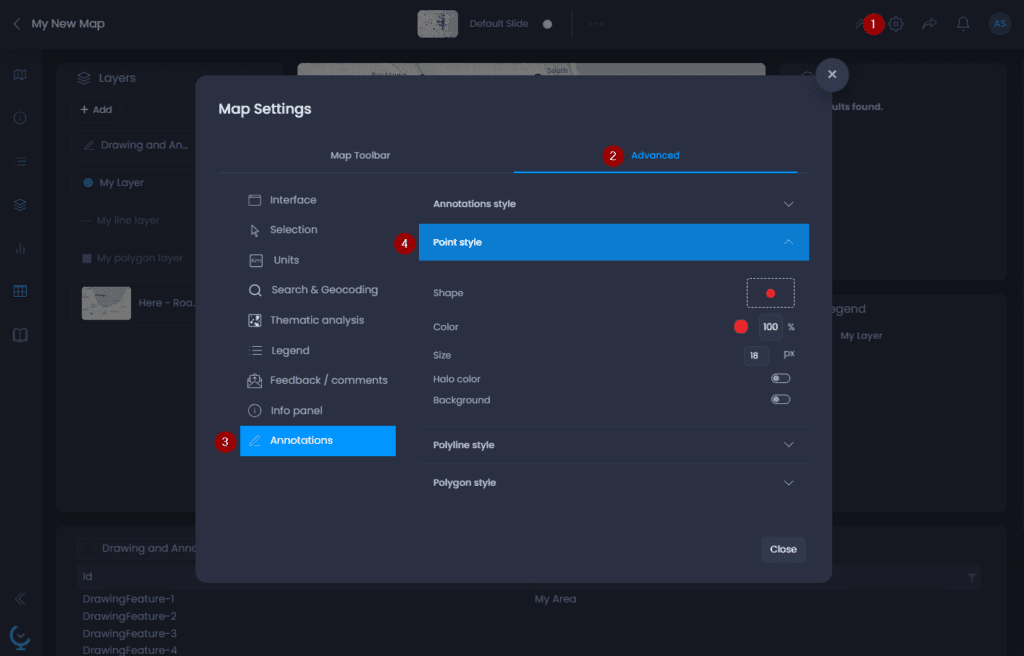
Map Creators with edit permissions on the map can change the default styles of drawings and annotations. Here are the steps:
- Open the “Map settings“
- Navigate to the “Advanced“ tab
- Navigate to the “Annotations“ section
- Choose a type of annotation and change the style settings
Please refer to our Annotation style section to learn more on the detailed style options.