

You can import multiple GeoTIFF files to create a time series on your map. Each GeoTIFF file stores a record of your time series, allowing you to play an animation, view time-based evolution and analyze your spatial data over time.
Create a time series
Import a GeoTIFF
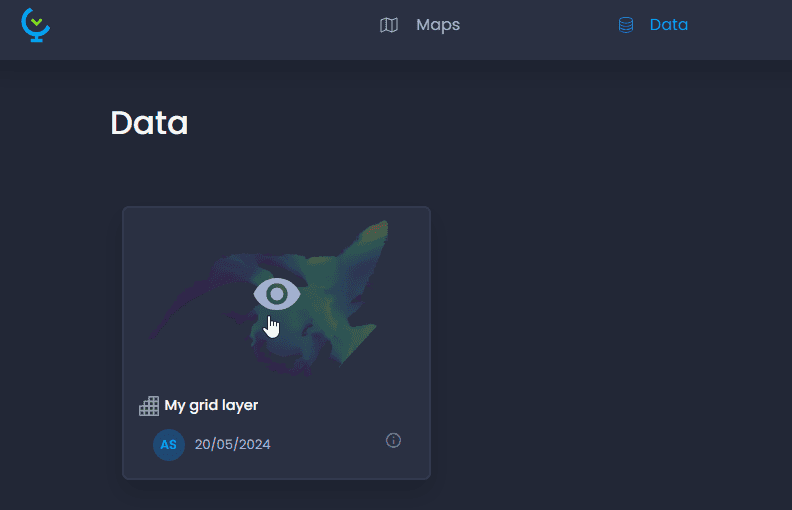
Upload your first Geotiff to your workspace. See how to add raster data here. Click on the grid layer preview in your Data Gallery to open the grid layer’s time series list of records.
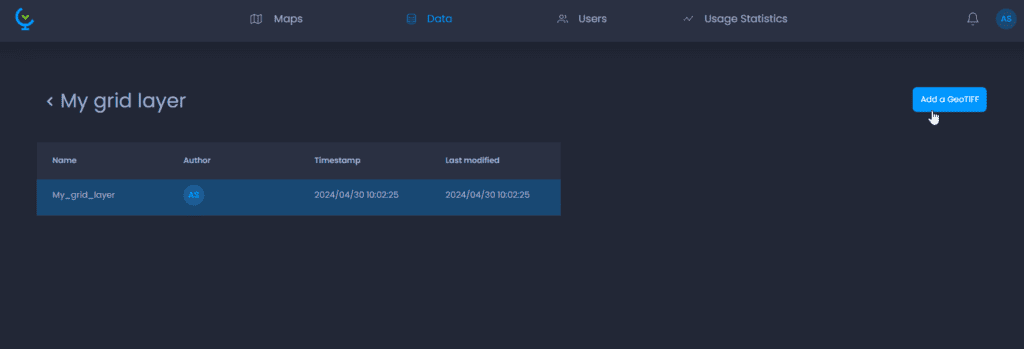
Click on “Add a GeoTIFF“:
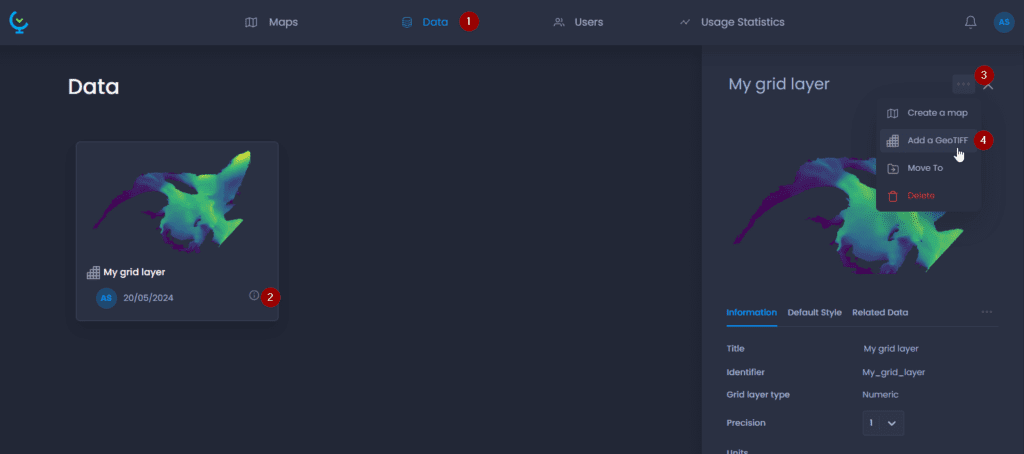
You can also click on your grid layer name or
![]()
to open the layer detail panel, click on the Actions … menu and click “Add a GeoTIFF“:
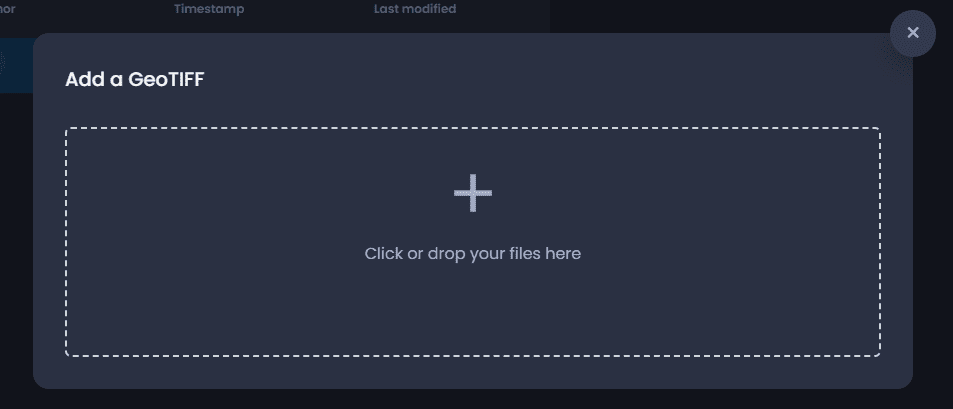
Drag and drop your new GeoTIFF file to the dropzone:
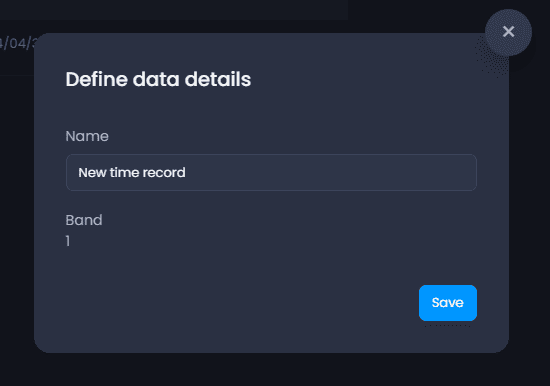
Once your file has been uploaded, you can set the details: rename your new time record and if necessary, select the band to be imported, then click Save:
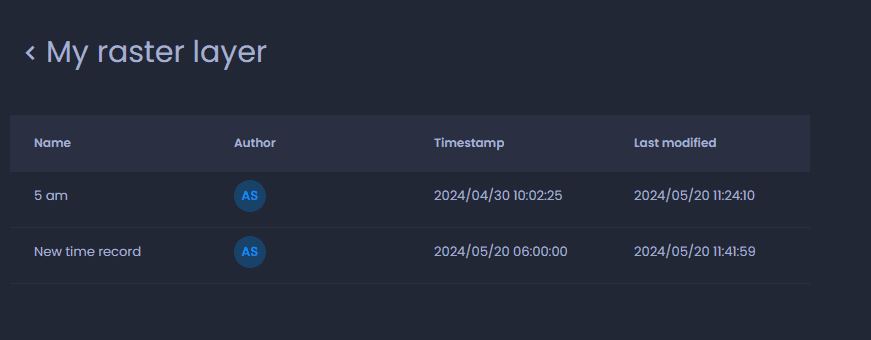
Check the notification to see the result of the import. If the import is successful, your new time record will be added to the list:
Set the timestamp and other properties
Once imported, you can edit the details of your new time record. Click on the row of your new record to open the detail panel:
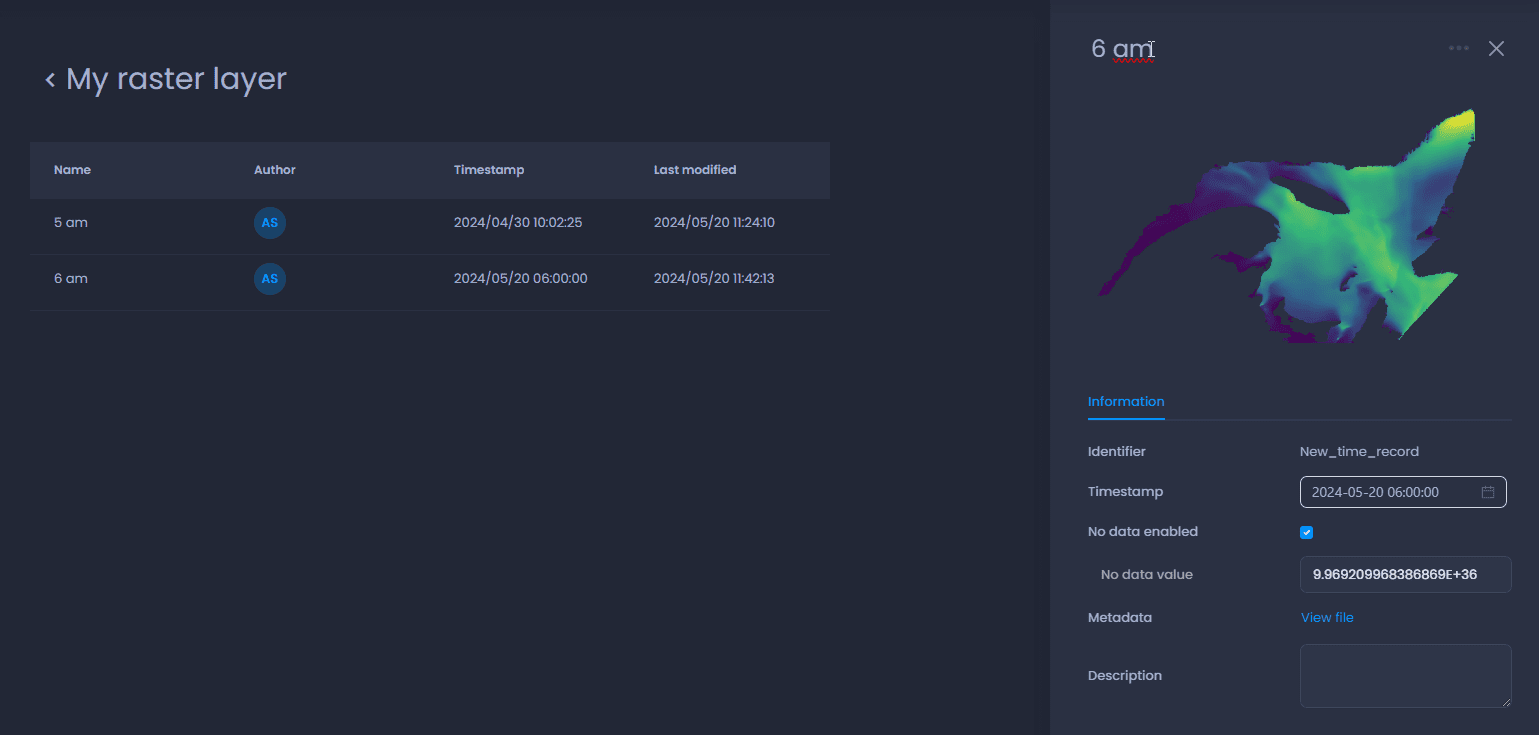
In this panel, you can:
- Rename the layer: click on the record name at the top of the panel
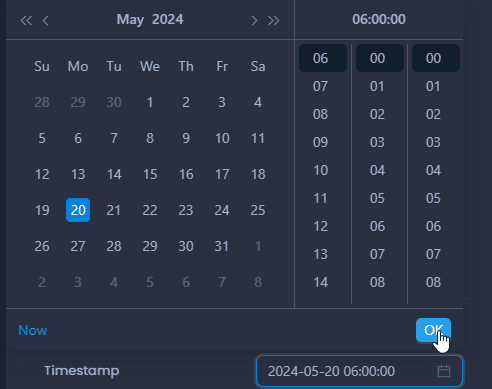
- Timestamp: use the time selector to change the timestamp. This will impact the order of your time records in your map. Make sure all time records have proper timestamps.
- No data: you can enable or disable the No data value and set the No data value when enabled.
- Metadata: you can view the metadata inherited from the GeoTIFF file
- Description: you can add a description.
Create a map with a time series
You can now use this grid layer in a map and enable specific time-based tools to view and analyze your time series.
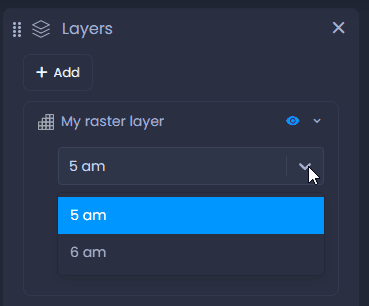
In the layer control you can choose the time record to view:
Time View
The Time View tool allows you to visualize the evolution of the grid value over time for a location.
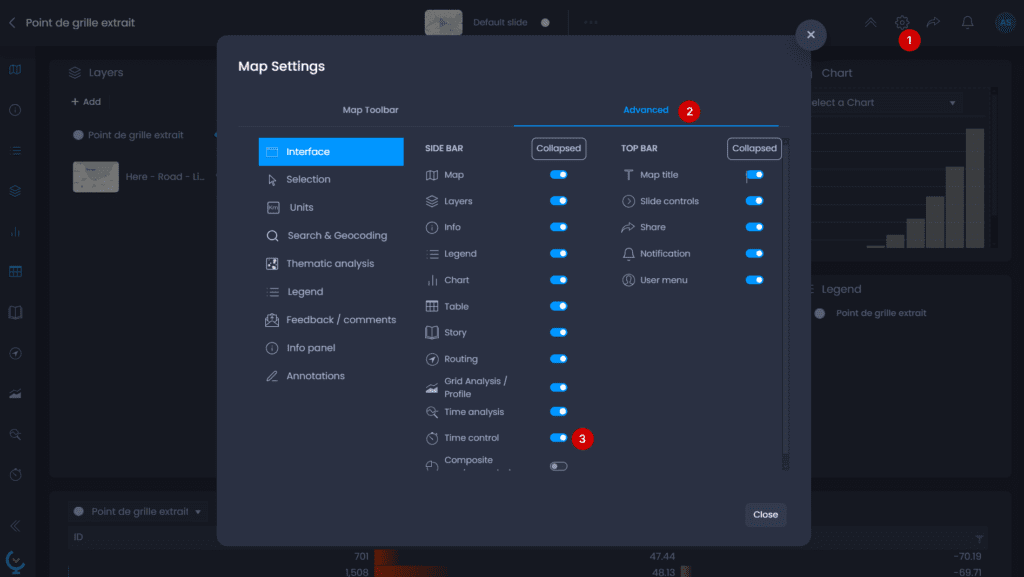
- Open the map settings to add the Time Analysis panel
- Go to the Advanced settings
- In the Interface tab, enable the Time Analysis tool.

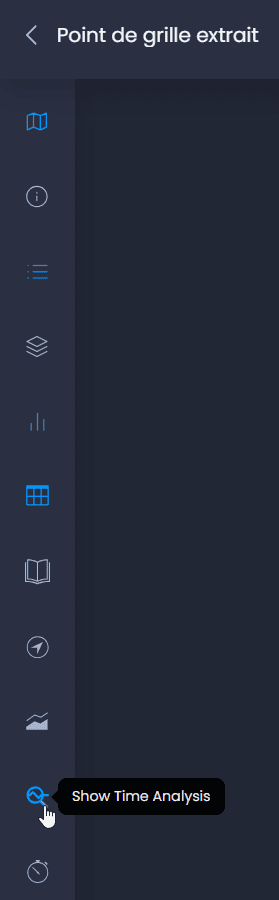
The Time View tool is now available in the left bar. Click on the icon to show the Time Analysis tool:
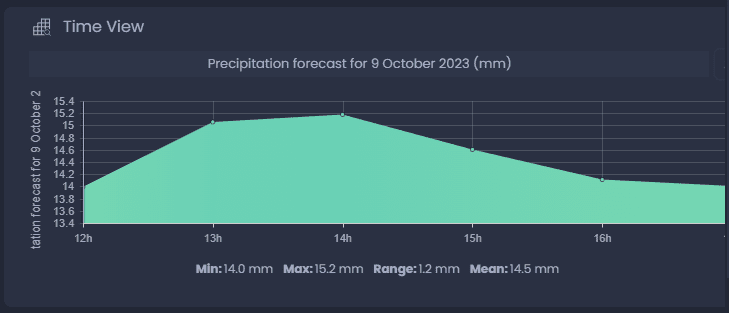
Click on a location on your map with the Pan and Info tool

or with the Info tool

to view the evolution of your grid data at this location in an area chart:
Time Control
The Time Control allows you to play an animation of your time series.
- Open the map settings to add the Time Control panel
- Go to the Advanced settings
- In the Interface tab, enable the Time Control.
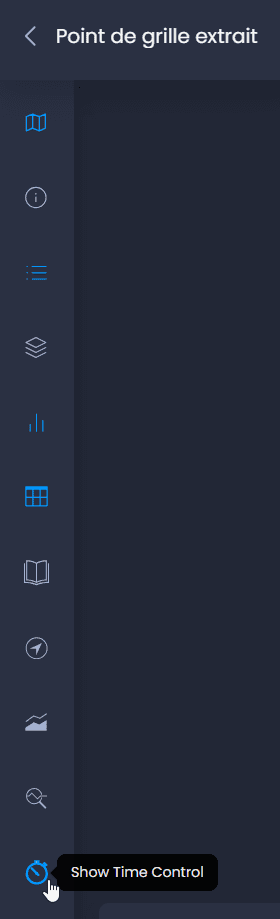
The Time Control is now available in the left bar. Click on the icon to show the Time Control panel:
You can now play an animation of your time series with the play button, or use the time controller to move back and forth in time.